ADA
An open-source data analyst that shows its math
What this is
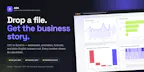
An open-source data analyst that cleans a CSV or Excel file, builds a dashboard, and shows the exact calculation behind every chart or forecast.
Our one-line summary — not the founder’s tagline.
- How it works
- Every chart/forecast traces to a readable pandas calculation
- What's different
- optional AI never sees your row data, only column schema; works with no API key
- Pricing
- open source, MIT licensed
- Best for
- anyone who wants an auditable alternative to a black-box data analyst tool
What we measured
Nobody else publishes this — it comes from knocking on the door every day.
- Watched by us
- 6 days
- Last checked
- 1h ago
Where it shows up
Every group here is a page of its own — each one checked daily.
The numbersIs it still shipping, is it overpriced, where did it land — and what the price is built from.
League price & chart
No money. No seat. It goes on your record — and in 28 days reality settles it.
Calls are closed while we rebuild accounts. You can still read every one of them.




Analytics. Launched 6d ago on Product Hunt, picking up 10 votes. Today, the site itself changed 1h ago — evidence it's still shipping, not just announcing.
Quiet for 2 days — no penalty yet, but quiet doesn't stay free.
We check this site every day, ourselves. A founder can post “still working on it” — a claim like that doesn't price. What we price is what we can verify from the outside: evidence, not announcements. The real question isn't “will this be huge?” — it's “will they still be moving in four weeks?”
Shipping record
1 separate day we saw this ship · source: page changed
Beyan değil kanıt: founder “çalışıyoruz” diye post atabilir, ama sevk ettiyse izi kalır. ⚠️ Kaydı olmayan ürün “sevk etmedi” demek değildir — o üründe izleyecek bir kaynağımız yok demektir.
The market viewHow this launch is priced and ranked in our league — the investor side of the page.
ranked by the reality anchor, not the market price
It launched on Product Hunt with 10 votes.
No matter how much money goes in. There is no pump here — you can't make yourself right by buying more. The line only moves on things that actually happened: an award, revenue that grew, a new platform, code that shipped — or silence.
1 quiet day in between are left out — nothing happened on them. A launch that goes quiet eases down a little at a time — never a cliff you could have run from the night before.
Daily tracking just started for this launch — the first point is on the board. A second reading lands with tomorrow's run, and the curve builds from there.
How the launch is moving on its own board, day by day — the crowd's attention.
A flat line is normal: votes stop within a day or two of launch, on every board. What's unusual — and what actually counts — is a launch that keeps pulling votes long after its day is over.
About
I tried to automate a data analyst. Contribute to sainesrop in a CSV or Excel file. ADA cleans it, builds a dashboard, flags anomalous periods, projects a guarded forecast, and answers questions about your data. The difference: every chart, every forecast, every chat answer traces back to a pandas calculation you can actually read. Nothing is a black box. Optional AI only ever sees your column schema, never your rows, and the whole product works with no API key. MIT Licensed (want contributors)
Where it launched
1 platform| Platform | Votes | Counts toward price | Link |
|---|---|---|---|
| Product Hunt | 10 | sets the price | ↗ |
The board it did best on sets the price. Every other board only adds to it if the launch also placed high on that board too — because just showing up somewhere isn't an achievement. Listing on twelve directories is free; placing well on them isn't.
Discussion (0)
No thesis posted yet. Be the first.